Como calcular a taxa de crescimento anual média/composta no Excel?
Este artigo discute maneiras de calcular a Taxa de Crescimento Anual Média (AAGR) e a Taxa de Crescimento Anual Composta (CAGR) no Excel.
- Calcular a taxa de crescimento anual composta no Excel
- Calcular a taxa de crescimento anual composta com a função XIRR no Excel
- Calcular a taxa de crescimento anual média no Excel
Calcular a Taxa de Crescimento Anual Composta no Excel
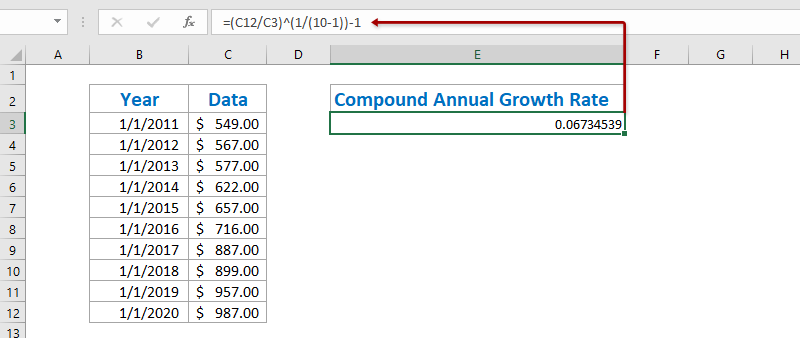
Para calcular a Taxa de Crescimento Anual Composta no Excel, há uma fórmula básica =((Valor Final/Valor Inicial)^(1/Períodos) -1. E podemos aplicar facilmente essa fórmula da seguinte forma:
1. Selecione uma célula em branco, por exemplo, a Célula E3, insira a fórmula abaixo nela e pressione a tecla Enter . Veja a captura de tela:
=(C12/C3)^(1/(10-1))-1
Nota: Na fórmula acima, C12 é a célula com o valor final, C3 é a célula com o valor inicial, 10-1 é o período entre o valor inicial e o valor final, e você pode alterá-los conforme suas necessidades.
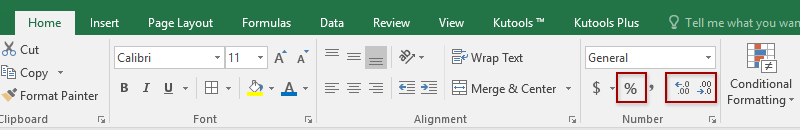
2. Em alguns casos, o resultado do cálculo pode não estar formatado como porcentagem. Continue selecionando o resultado do cálculo, clique no Estilo de Porcentagem botão ![]() na Guia Página Inicial para alterar o número para o formato de porcentagem, e depois altere suas casas decimais clicando no Aumentar Casas Decimais botão
na Guia Página Inicial para alterar o número para o formato de porcentagem, e depois altere suas casas decimais clicando no Aumentar Casas Decimais botão ![]() ou Diminuir Casas Decimais botão
ou Diminuir Casas Decimais botão ![]() . Veja a captura de tela:
. Veja a captura de tela:
Calcular a taxa de crescimento anual composta com a função XIRR no Excel
Na verdade, a função XIRR pode nos ajudar a calcular facilmente a Taxa de Crescimento Anual Composta no Excel, mas requer que você crie uma nova tabela com o valor inicial e o valor final.
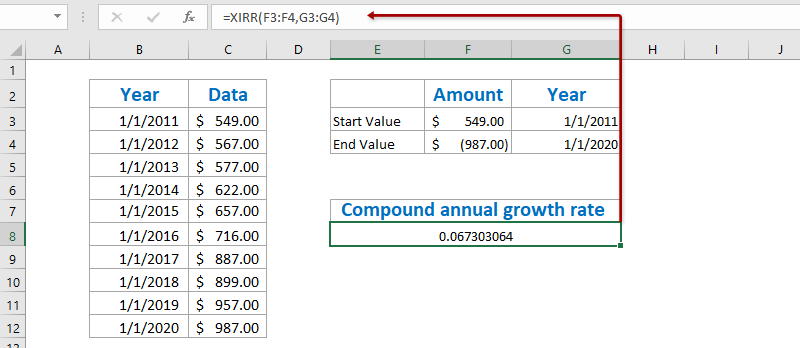
1. Crie uma nova tabela com o valor inicial e o valor final, conforme mostrado na primeira captura de tela abaixo:
Nota: Na Célula F3, insira =C3, na Célula G3, insira =B3, na Célula F4, insira =-C12, e na Célula G4, insira =B12, ou você pode inserir seus dados originais diretamente nesta tabela. A propósito, você deve adicionar um sinal de menos antes do Valor Final.
2. Selecione uma célula em branco abaixo desta tabela, insira a fórmula abaixo nela e pressione a tecla Enter.
=XIRR(F3:F4,G3:G4)
3. Para alterar o resultado para o formato de porcentagem, selecione a Célula com esta função XIRR, clique no Estilo de Porcentagem botão ![]() na Guia Página Inicial e depois altere suas casas decimais clicando no Aumentar Casas Decimais botão
na Guia Página Inicial e depois altere suas casas decimais clicando no Aumentar Casas Decimais botão ![]() ou Diminuir Casas Decimais botão
ou Diminuir Casas Decimais botão ![]() . Veja a captura de tela:
. Veja a captura de tela:
Salve rapidamente a tabela CAGR como um mini modelo e reutilize com apenas um clique no futuro
Deve ser muito tedioso referenciar células e aplicar fórmulas para calcular as médias toda vez. O Kutools para Excel oferece uma solução prática com o utilitário AutoTexto para salvar o intervalo como uma entrada de AutoTexto, que pode manter os formatos de células e fórmulas no intervalo. E então você poderá reutilizar esse intervalo com apenas um clique.
Calcular a Taxa de Crescimento Anual Média no Excel
Para calcular a Taxa de Crescimento Anual Média no Excel, normalmente temos que calcular as taxas de crescimento anual de cada ano com a fórmula = (Valor Final - Valor Inicial) / Valor Inicial, e depois fazer a média dessas taxas de crescimento anual. Você pode fazer o seguinte:
1. Além da tabela original, insira a fórmula abaixo na Célula C3 em branco e, em seguida, arraste a Alça de Preenchimento até o Intervalo C3:C11.
=(C4-C3)/C3
2. Selecione o Intervalo D4:D12, clique no Estilo de Porcentagem botão ![]() na Guia Página Inicial e depois altere suas casas decimais clicando no Aumentar Casas Decimais botão
na Guia Página Inicial e depois altere suas casas decimais clicando no Aumentar Casas Decimais botão ![]() ou Diminuir Casas Decimais botão
ou Diminuir Casas Decimais botão ![]() . Veja a captura de tela:
. Veja a captura de tela:
3. Faça a média de todas as taxas de crescimento anual inserindo a fórmula abaixo na Célula F4 e pressione a tecla Enter .
=MÉDIA(D4:D12)
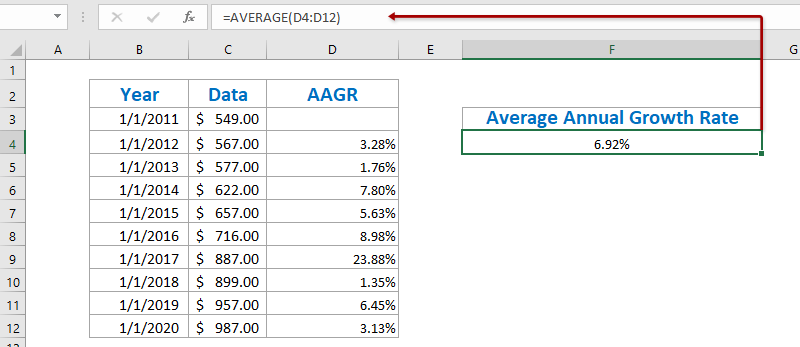
Até agora, a Taxa de Crescimento Anual Média foi calculada e exibida na Célula C12.
Demonstração: calcular a taxa de crescimento anual média/composta no Excel
Artigos relacionados:
Melhores Ferramentas de Produtividade para Office
Impulsione suas habilidades no Excel com Kutools para Excel e experimente uma eficiência incomparável. Kutools para Excel oferece mais de300 recursos avançados para aumentar a produtividade e economizar tempo. Clique aqui para acessar o recurso que você mais precisa...
Office Tab traz interface com abas para o Office e facilita muito seu trabalho
- Habilite edição e leitura por abas no Word, Excel, PowerPoint, Publisher, Access, Visio e Project.
- Abra e crie múltiplos documentos em novas abas de uma mesma janela, em vez de em novas janelas.
- Aumente sua produtividade em50% e economize centenas de cliques todos os dias!
Todos os complementos Kutools. Um instalador
O pacote Kutools for Office reúne complementos para Excel, Word, Outlook & PowerPoint, além do Office Tab Pro, sendo ideal para equipes que trabalham em vários aplicativos do Office.
- Pacote tudo-em-um — complementos para Excel, Word, Outlook & PowerPoint + Office Tab Pro
- Um instalador, uma licença — configuração em minutos (pronto para MSI)
- Trabalhe melhor em conjunto — produtividade otimizada entre os aplicativos do Office
- Avaliação completa por30 dias — sem registro e sem cartão de crédito
- Melhor custo-benefício — economize comparado à compra individual de add-ins